Agile 02
1. User Story Mapping
–A technique to envisage the entire software product as a series of steps in which the user completes tasks to achieve the goals
一个用户目标需要一系列的步骤去实现。
–involves building a series of user stories as an iterative process to produce solutions
一系列的用户故事去完成迭代
–enables user stories with solutions to be grouped to achieve their respective goals
一起开发的用户故事(实现一个迭代功能)被打包,
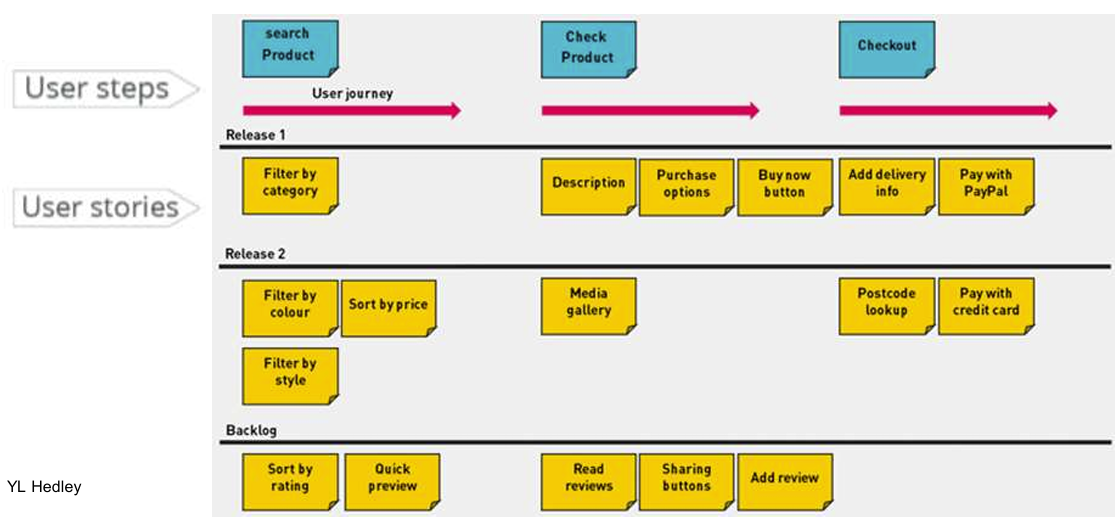
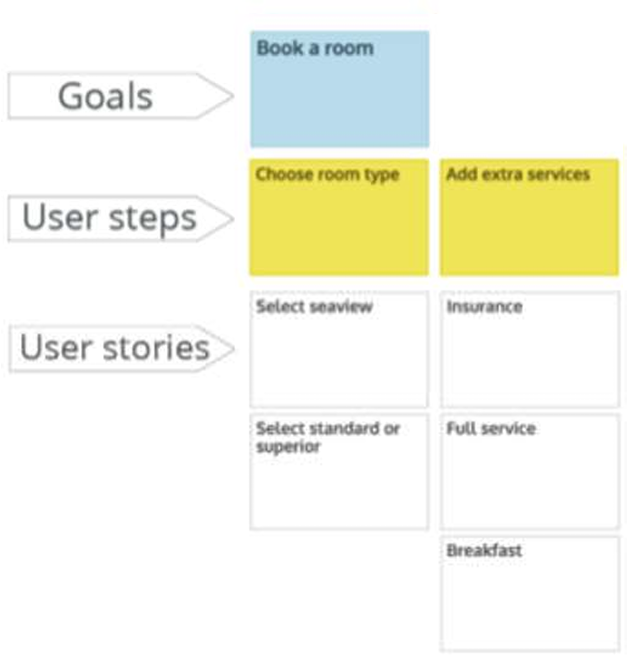
1.1 Example: Hotel booking website
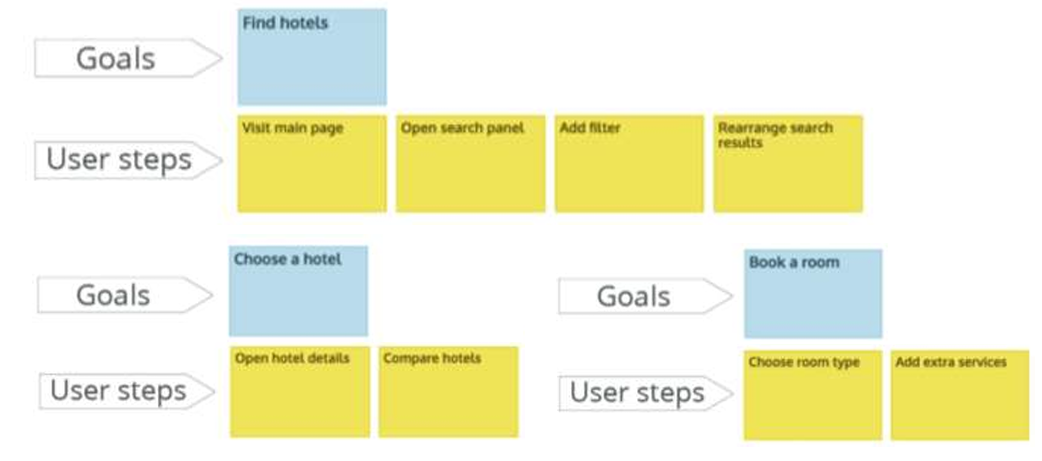
Step 1: identify the goals

Step 2: mapping the steps to achieve the goal
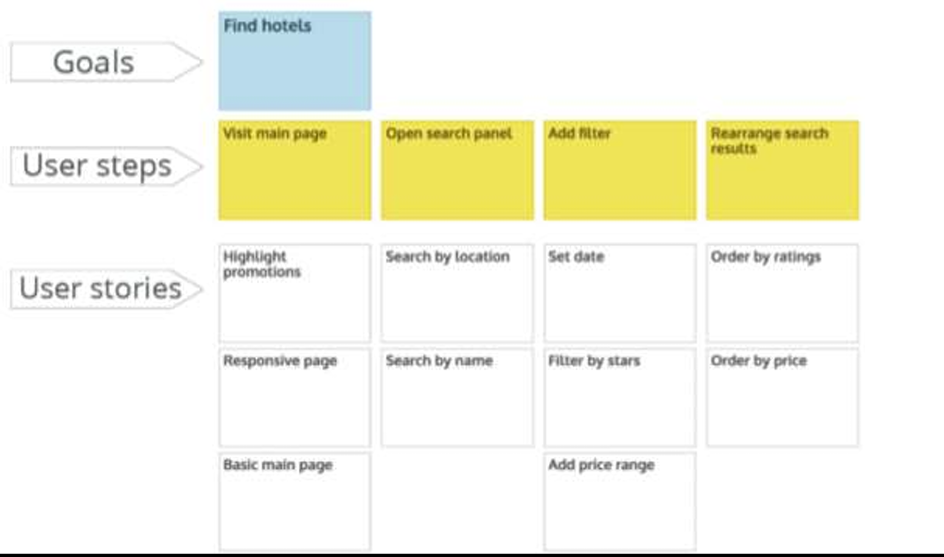
Step 3: building user stories to produce solutions for ‘Find hotels’, e.g.
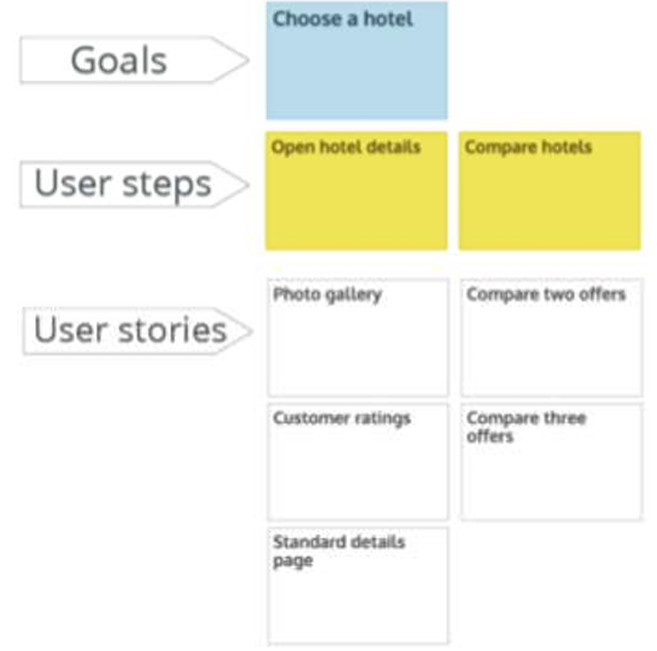
Choose a hotel
Book a room
2. Story Points
A story point is used to measure the amount of effort required to implement a story, depending on the project, which may refer to number of units, complexity, technical risk.
故事点用于衡量实施一个故事所需的工作量,具体取决于项目,可能指单元数、复杂性、技术风险。
e.g. in a User Interface (UI) centric project, story points might be the number of widgets on a screen.In a database-centric project, to number of tables or columns.
例如,在以用户界面 (UI) 为中心的项目中,故事点可能是屏幕上小部件的数量。
a measurement of a feature’s size relative to other features may be used in estimation (not the time needed to complete a feature)
估算中可能会使用一个功能相对于其他功能的大小的测量值(而不是完成一个功能所需的时间)
With traditional estimation, the team examines the major work tasks to derive an estimate. In contrast, with story points, the agile team instead may compare the size and complexity of features.
在传统估算中,团队通过检查主要工作任务来得出估算结果。相比之下,使用故事点时,敏捷团队可以比较功能的大小和复杂程度。
2.1 Estimation
2.1.1 Numeric estimation:
•Each team member given a set of cards with numbers on them, ordered the user stories using the Fibonacci sequence (0, 1, 2, 3, 5, 8, 13, 21, 34, 55, 89, …) as story points to do relative estimates. In practice, the numbers 0, 1, 2, 3, 5, 8, 13, 21, 40, 100 are used.
• The main benefit of the Fibonacci scale is that enough separation exists between the numbers to prevent the team from emphasising over slight differences, e.g., using numbers, 1, 2, 3, 4, 5…, 10
运用 0,1,2 3,5,8,13,21,40,100来衡量功能的大小。
2.1.2 Non-numeric estimation:
T-shrit animal or other things…
3. Agile Estimation Techniques
- Planning Poker: to estimate the work to be done
- T-Shirt Sizes: to estimate the work to be done
- Relative Mass Valuation: to estimate the work to be done
- Velocity: to measure a team’s capacity to complete work
注意:前三种方法都是单纯衡量要完成的一项任务的大小(可以看做要跑的路程),最后一种是团队完成这项任务的能力(可以看作人来跑这一段路程的速度)。
3.1 Planning Poker
–Played by team members during planning meetings
–Each team member given a set of cards with numbers on them, ordered from 0 to 21 using the Fibonacci sequence(0, 1, 2, 3, 5, 8, 13, 21, 34, 55, 89, …) as story points to do relative estimates. In practice, the numbers 0, 1, 2, 3, 5, 8, 13, 21, 40, 100 are used.
• A story estimated as a 2 should be about one fourth as difficult as a story estimated as an 8.
• Stories estimated at 20 or higher may be so large that they need to broken up into smaller stories before they can be attempted. Stories estimated at 0 may not even be worth tracking.
- 估计为 2 分的故事难度应为估计为 8 分的故事难度的四分之一。
- 估计难度为 20 或更高的故事可能非常庞大,需要分解成更小的故事才能尝试。估计值为 0 的故事可能根本不值得跟踪。
用上文提到的斐波那契数列,每个人在不与其他人讨论的情况下估算此次任务量。
3.2 T-Shirt Sizes
–Benefits: can be very effective for teams just starting out with agile
在刚刚开始着手这项敏捷任务时非常便于估算
–Limitations:
•Lack of a mathematical relationship between different measurements, such as a medium and an extra-small.
•May still need to be converted to numerical values at a later stage for tracking effort over time and charting an estimated velocity for the team.
3.3 Relative Mass Valuation
–user stories are estimated relative to each other in size, not on the basis of hourly effort
不估算其本身的大小,还是跟其他故事点相比较而言的大小。
–quick way to go through a large backlog of user stories and estimate them all based on how they relate to each other.
是一个可以快速浏览全部故事点并对其大小心里有点数的方法
–to reach a rough point estimate, not a precise order
粗略估算!
3.4 Velocity
–a measure of a team’s capacity to get work done in a given iteration (or sprint);
–expressed as a range of numbers, e.g. 23 to 32 story points per sprint, especially early on in a project’s life
–used to plan releases and adapt work as progressing through a project, so as to adjust the forecast for completion regularly and accurately through execution
-用于计划发布和调整项目进展中的工作,以便通过执行定期准确地调整完成预测
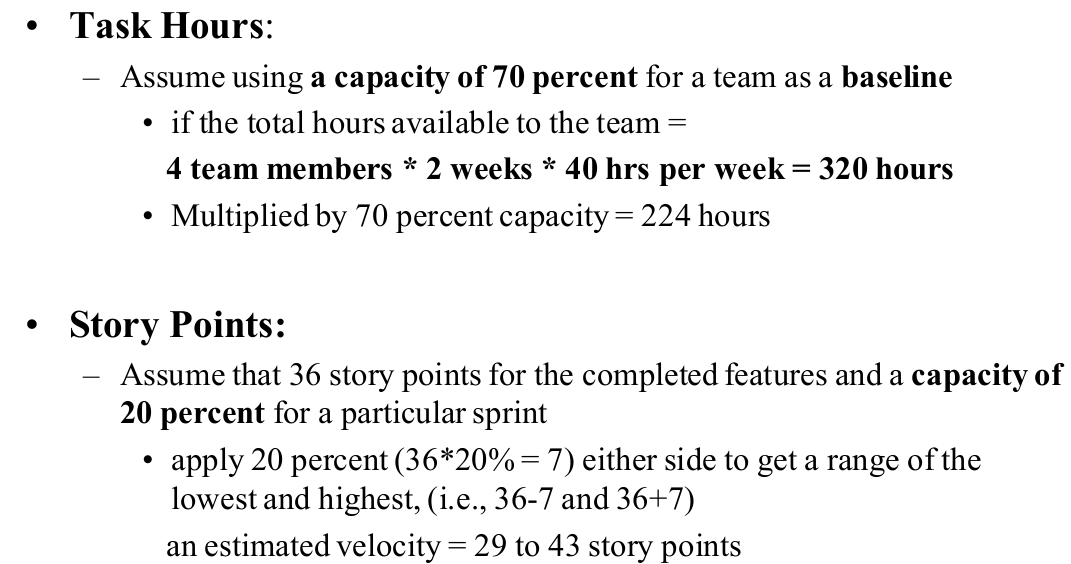
-breaks down user stories for a sprint into tasks. Estimate the number of hours each task will take, which includes design, development, testing, etc.
-将冲刺阶段的用户故事分解为任务。估算每项任务所需的小时数,包括设计、开发、测试等。
To use hours to estimate the amount of effort required to complete a Task; whereas Story Points to estimate the amount of effort required to complete a User Story
用小时数估算完成任务所需的工作量;用故事点数估算完成用户故事所需的工作量
4. Task BreakDown
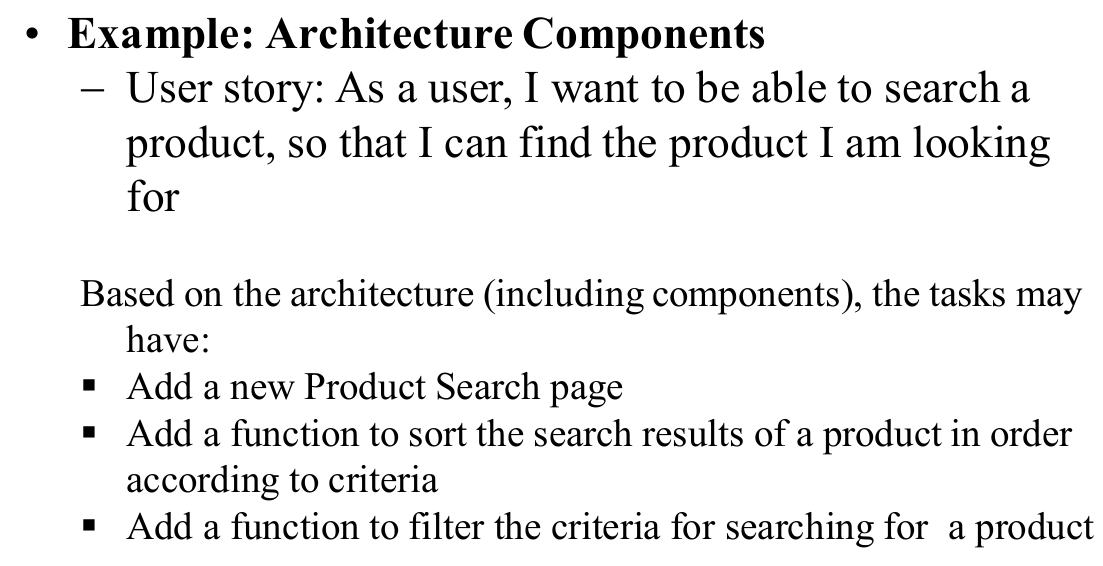
4.1 Example
4.2 criteria
- To create meaningful tasks. For example, instead of having ‘coding’ as a task, the tasks can be given as ‘Develop the login class’ or ‘Create a user table and save the login data to the database’
- To create tasks that are right-sized. As a general guideline for the size of the tasks is to have tasks that require less than 8 hours. Avoid to break down the tasks that are very small, to a minute level such as 10, or 30 minutes etc.
4.3 DOD
To use the Definition of Done (DOD) as a checklist to produce a list of tasks. The DOD defines the completeness criteria of a story. For example, DOD may include ‘Coding tasks completed’ or ‘Unit testing written and passed’.
4.3.1 Example: DOD
~ User story: As a user, I want to be able to search a product, so that I can find the product I am looking for
DOD –> Task
Design for product search is completed –> Produce the design model for product search function
Code for product search is completed –> Write code for the product search page
Automated UAT (User Acceptance Tests) for product search is passed –> Write and run UATs for the product filtering feature
Documentation for product search is updated 产品搜索文档已更新 –> Document the product search features 记录产品搜索功能
5. Sprint Planning and Tracking
5.1 Burn-up chart
shows how much work has been completed, and the total amount of work, which may be produced when the teams updates their release plan.
5.2 Burn-downs charts
shows how much work is remaining to be done in the project, different approaches: e.g. −The effort remaining approach: A task breakdown during the sprint planning meeting reflects progress assuming that all tasks will be completed within the sprint at a uniform rate
look like:
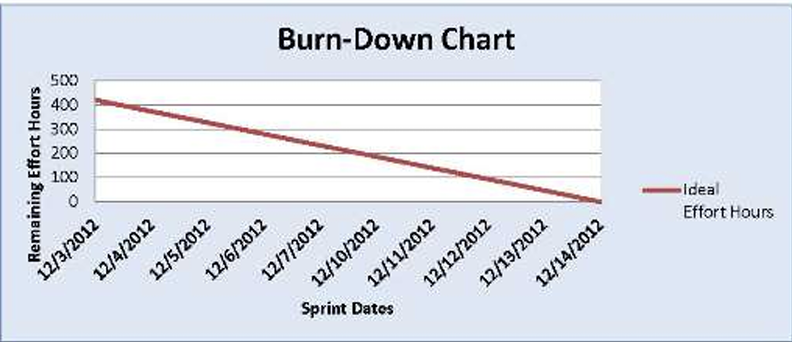
Example: if the total estimated effort for Task 1 is 8 hours at the start of a sprint, after working on the task, if the team member believes that it requires another six hours to complete, the "Effort Remaining" should be updated as 6.

